
Mike is a Principal Consultant for ThreeWill. He has a passion for solving problems, most notably through products or platforms. He has almost 20 years of experience in product development and leadership, using the latest and greatest technologies, including open source technologies.
Many organizations talk the talk when it comes to buzzwords like “transparency, accountability, and employee engagement.” But does your organization walk the walk? Oftentimes, organizations might associate transparency and openness with communication and that’s absolutely true. But another crucial way an organization can promote a culture of trust and transparency is through reporting – namely reporting available to all within your organization. In this article, I want to discuss the importance of transparency in keeping your employees engaged, the role that reporting plays in that, and how we have done this for customers at ThreeWill.
The Role of Transparency in Employee Engagement
One of ThreeWill’s core offerings is our Intelligent Intranet solution. In the early stages of an engagement, we typically want to align on a working definition of an intranet, to align on the types of content that will be made and stored within its walls, and by whom. One of the chief aspects of a good intranet is transparency. We also often talk about ways to bring out your culture within your Intranet. Communicating openly and honestly is an important way to reinforce a culture of trust and togetherness.

This sounds right, but does the data back it? Gallup produces a yearly State of the Global Workplace report. This report focuses on employee engagement worldwide. And in this report, it emphasizes the role of transparent communication from leadership in fostering engagement and creating a positive work environment. Transparency fosters trust among stakeholders, both internal and external. It promotes open and honest communication within an organization. When stakeholders have access to accurate and timely information, they feel informed and involved in decision-making processes. That’s a culture you want to be a part of. That’s a culture where you have a voice. That’s a culture where you’re more likely to be and stay engaged.
Reporting as next-level communication
Communication is key in any organization, characterized as being timely, succinct, relevant, and transparent. Reporting is another form of communication. But it can take you beyond normal communication and really start to hit some of those characteristics I mentioned. It goes beyond regular exchanges of information and takes a structured and systematic approach to conveying key data and insights. Reporting facilitates data-driven decision-making by presenting relevant and reliable data in a format that is easily accessible and understandable. If it’s widely available to your organization, then there’s no excuse for feeling left out.
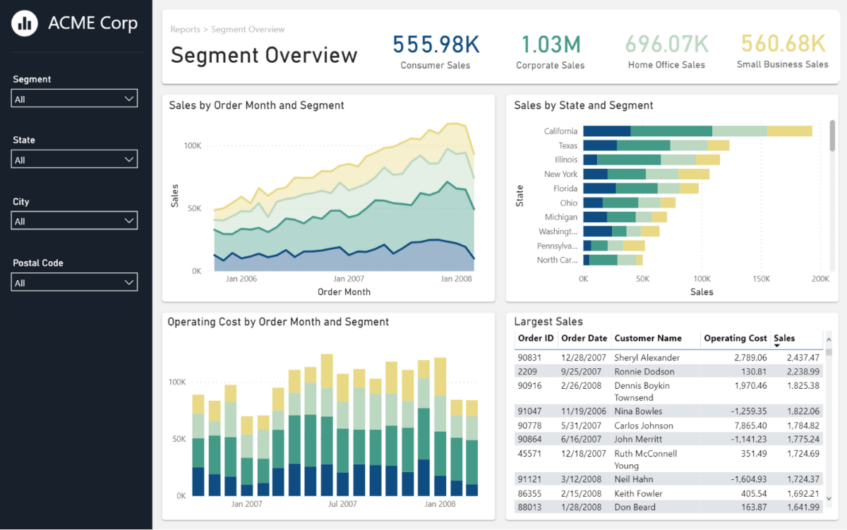
Reporting often employs visualizations, such as charts, graphs, and dashboards, to convey complex information in a visually appealing and easily digestible manner. These visual elements help stakeholders grasp key insights quickly and make connections between different data points. It’s engagement-in-action.

Reporting aligns communication with strategic goals and objectives. And it proves itself to be transparent and open when it is holding everyone in the organization accountable for what the metrics in the reports are highlighting. There’s no pulling the rug out from people. It is a visual representation to everyone that “this is what we are holding ourselves to”. It’s put up or shut up, to put it bluntly.
Power BI: this is the way
At ThreeWill, as a Microsoft 365 partner, we have embraced Power BI as a way to make reports that are both engaging and transparent. It is a tool that is both polished and powerful – capable of ingesting countless amounts of data from countless sources and transforming it into something coherent and crisp.
Is it something anyone can work with? Well, yes and no. As I mentioned, it’s extremely powerful. It has a lot going on but can be summarized by these 3 main steps: Extract, Transform, and Visualize. Visualizing is the easy part. And if you have the right folks extracting and transforming your data, then yes, you can absolutely go to town on visualizing. Transforming is the hard part and you want the right people working on it – understanding the source data and how they all relate and how those various data points will be important in the final calculations and potential displays. So, at this point, I’ll give you the shameless plug for ThreeWill – we know how to dig in and get the data setup right so that your visuals can be spot-on.
Power BI in practice: Gross Margin reporting
Let’s look at a recent project we did for a customer that is making good on leveraging reporting as a higher form of communication and working towards transparency and accountability. This customer is focusing heavily on making sure that their services are finely tuned to provide maximum value to their clients while also providing the best return on that work. Gross margin can be used to measure how much was spent on a project versus what was made on it. This is the direction of the company and a primary goal for any workers involved in projects. And this organization is holding itself accountable to these goals and using the information gathered to iterate and grow. Is it a bit of a risk to show this much information to everyone? Sure. But it’s a risk worth taking, when you want a culture built around a common vision – “We are in this fight together.”
The vision was clear: give all employees the ability to see what any given project’s gross margin and effective bill rate was, even while the project was underway so that adjustments could be made on-the-fly. Additionally, give everyone a sense of what the overall company’s health was, in terms of an overall gross margin and an overall effective bill rate. This meant extracting all of the time logged, whether that be billable or non-billable, and transforming it to meet our end goals.
KISS
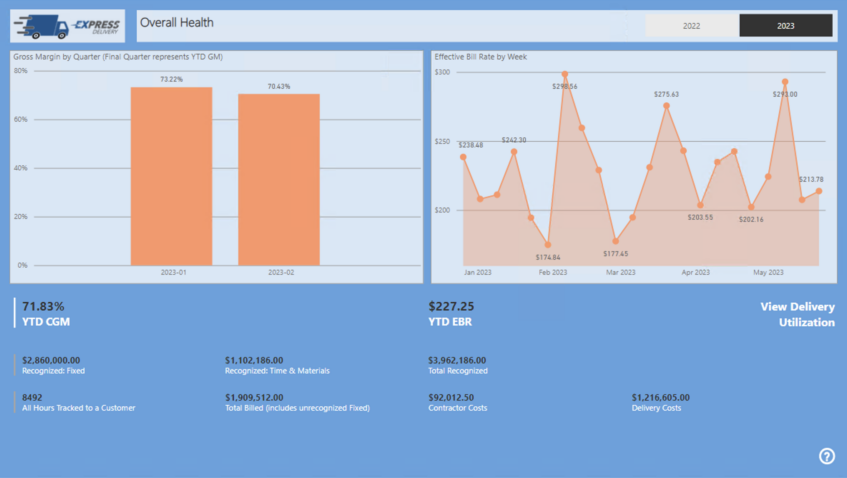
With reporting, we want to follow the KISS acronym as often as possible: Keep It Simple, Stupid. Do we need details? Yes. Do we need those details everywhere? No. First, we want to focus on the biggest numbers: are we winning or losing? If something looks wrong, then we might want to dig in and get a closer look.
So, we have an overall health report that gets us down to just 2 numbers: the company’s overall gross margin to date for the year and their average bill rate. These numbers will give us a quick indication of whether we are winning or losing. We use visuals to try and convey any trends of “going up” or “trending down”.
Then we have more detailed reports that show the breakdown per project. This helps individual teams assess how they are contributing, both positively and negatively, to overall health. Then we include reference tabs to keep everyone on the same page, without having to look anywhere else. Lastly, we ensure that this Power BI app is shared with everyone and placed in a prominent place.
So, if I’ve moved the needle on whether or not this level of transparency and accountability are important for your organization and the type of engagement you want from your employees, then reach out to us today to see how we can help.
CONTACT THREEWILL TO BEGIN YOUR MICROSOFT POWER PLATFORM JOURNEY.